Testing Hypotheses About Counts
Section outline
-
Topic 4
Learning outcomes: Understand the statistical meaning of independence of the rows and columns of a table. Appreciate the importance of quantifying the association between a risk factor and an outcome.
Calculate a chi-square test of independence; identify the necessary assumptions; discuss the effect of sample size on your conclusions. Calculate and interpret a relative risk ratio and an odds ratio. Explain their importance.
-
Students mustViewMake forum posts: 1Welcome to Topic 4! You are more than half way through the module, so don't forget to give yourselves a congratulatory pat on the back!
Before you attempt the exercise, please read the remainder of Chapter 5 in the e-book.
In topic 3, we learned how to test hypotheses about population means. In this topic, we will look at count data. Read on for the exercise questions…
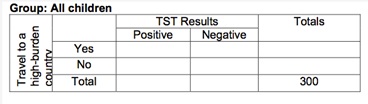
Exercise: Results for travel to a high-burden TB country.
In this study, 300 children received a tuberculin skin test (TST), of which 80 had a positive TST result. [Note: parents of all included children consented to be in this study.]
Of the 300 children, we know 22 had travelled to a high-burden TB country during the 12 months prior to their TST.
We also know 12 of the 80 children with a positive TST had travelled to a high-burden TB country during the 12 months before their skin test.
Q1: Populate this table using the information provided above
Once you have done this:
Q2: Formulate a hypothesis for this question
Q3: Choose an appropriate test statistic to test the association and justify the use of the statistic
Q4: Calculate an odds ratio (OR) and provide an interpretation of the findings.
Q5: Calculate a relative risk ratio (RR) and provide an interpretation of the findings.
You can use any statistical package available to you if needed!
-
Students mustViewReceive a gradeReceive a passing grade
Practice questions for Topic 4.
-